
RouteXL
RouteXL is an add-in to SpatialXL that allows optimised routing, transportation scheduling and high-speed bulk routing operations.

Transportation Scheduling

How to set up and input your data
❖Load your Routing Network by browsing to your .routingDB file. Your Routing Network will be displayed in the bottom right corner of your RouteXL window. I loaded newzafza.routingDB which is the South African Routing Network.


❖The Depots tab is automatically selected first by default. Copy from your Excel spreadsheet and Paste from Clipboard by right clicking in the Depots area – You can have more than one Depot set up. I just have one set up for my example.


❖Your Longitude and Latitude will now be populated for your Depots.

❖Select your Call Points tab now. Copy from your Excel spreadsheet and Paste from Clipboard by right clicking in the Call Points area.
(Note: You need to have a pre-set-up Cluster column in your Excel spreadsheet. I used the Auto Cluster tool from SpatialXL to generate these clusters in this example.)

❖Your Longitude and Latitude will now be populated for your Call Points.
![]()
❖Click the dropdown arrows and select Stop Long and Stop Lat.
The purpose of these columns is for example if you have a refuse disposal company like Pikitup, after you have collected what refuse you can you might need to dump it at a dump site which is not the same as the depot. You might do many trips to the dump site before you return at the end of the day back to the depot.
❖Click the dropdown arrow under Link and select Depots. (There needs to be a common column with common data between the Depots and Call Points. This will be your link and will allow the program to process your data correctly.)
❖You can set up Delay if you have a delay at your Depot. I don’t have a delay in this example, so I just left the field blank.
❖You can set up Extra Distance if you have any extra distance to add to your Depot. I don’t have any extra distance I would like to add to my Depot in this example, so I just left the field blank.

❖Click on the dropdown arrow by Cluster column and select CLUSTER.
❖Click on the dropdown arrow under Link for Call points and select DEPOTS.
❖You can set up Delay if you have a delay at your Call points. I don’t have a delay in this example, so I just left the field blank.
❖You can set up Extra Distance if you have any extra distance to add to your Call points. I don’t have any extra distance in this example, so I just left the field blank.

❖Shift time at this point is not being used as we are first scheduling the routes. The trips will be scheduled later where we can then use Shift time.
❖Load will be your volume. Click the dropdown arrow and select VOLUME.
❖Factors for Delay and Extra Distance are set at a default 1 which means nothing is changed. If there is a factor that is needed to be put in for this, you can adjust accordingly. A factor of 0.5 for example for Delay and Extra Distance would mean that the Delay and Extra Distance for the Depot or Call point would be half - A factor of 2 for example would mean twice as long.
![]()
❖Max Parallelism is set at 1 as a default. This is the basic setting for processing your data.
❖Call ID is your Unique ID for your Call points data – this ID needs to be unique in order to do the routing correctly.
❖You can choose to Optimze by First Weight (Meter) or Second Weight (Minute). I have chosen the latter in this example.

❖Click on Calculate and select Routes.

❖Your routes were Calculated in 1077ms which is 1077 milliseconds. The Results tab is now populated.
Understanding your data
![]()
❖Return Trip is populated which is the Distance and Time it takes to go back to the Depot from the Stop point which could be your dump site in this example.
❖Amount is your total volume or load of all your clusters together for Depot1.

❖Expand Depot1 by clicking on the +.
❖You will see all your clusters there populated under Cluster Key.
❖Is Initial ticked on means it is the initial trip from the Depot to the Call points and not from the Stop point to the Call points.
❖Distance and Time is the total round trip for each cluster.

❖The above are the rest of the columns.
❖Trip contains both Distance and Time in this column which are the total round trips for each cluster.
❖Geometry is internal information – it is basically showing the routes for each cluster in terms of Longitude and Latitude.
❖Start Trip column shows the total Distance and Time from the Depot to the Call points in each cluster.
❖Subsequent Trip column shows the total Distance and Time from the Stop point set up to the Call points in each cluster. (If you didn’t have a Stop Long and Stop Lat set up, Subsequent Trip column would be blank.)
You haven’t scheduled your trips yet so the program in the meantime gives you a possibility of two routes your vehicle/truck could travel – per Start Trip and Subsequent Trip.
❖Amount is the total volume/load per each cluster.
❖Trip Points column is internal information and not necessary to go over in this training manual.


❖To view the information within each cluster, click on the + by the cluster number. Then click on the button highlighted above to view that information clearly.

❖Here are all your Call points for cluster 9.
❖Order is the sequence the Call Points are to be visited optimized by time.
❖Amount is the volume/load per each Call point.
❖Call Delay and Call Distance are blank as I didn’t set up any Delay or Extra Distance for my Call points.
❖User ID is the Unique ID from your Call points data.
❖Node ID are the points on your routing network relative to each Call point.
❖Time From Last1 and Distance From Last1 are the distances and times from each Call point to the next starting at the Depot.
❖Time From Last2 and Distance From Last2 are the distances and times from each Call point to the next starting from the Stop point which is 0.
(Time From Last2 and Distance From Last2 would be unpopulated if you didn’t have a Stop point set up.)
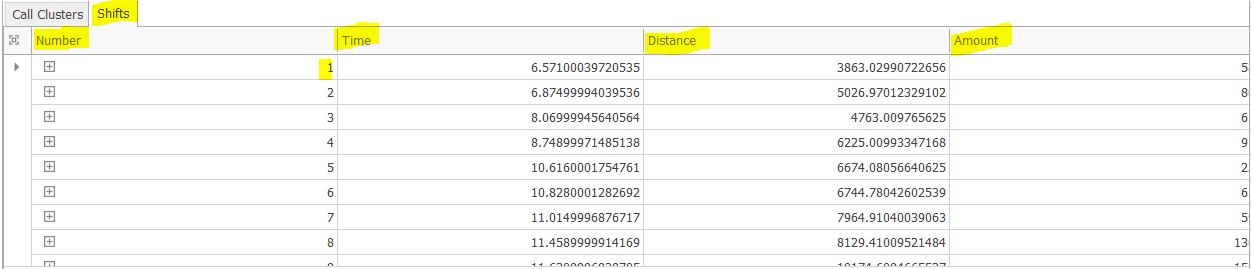
❖Go out of your Call Clusters tab and select Shifts.
❖Number are the different Shifts. Since we didn’t schedule any trips yet, each cluster will be a shift, returning back to the Depot each time.
❖Time and Distance are the times and distances travelled for each shift.
❖Amount is the total volume/load for each shift.

❖You have an option of inserting a Shift time. This is in minutes.

❖If you have a Shift Time set up, click on Calculate, then select Schedule trips.

❖You can’t immediately see what has changed, but if you go to your Call Clusters tab you will see clusters that don’t have Is Initial ticked on. This means that these clusters were routed from the Stop point to the cluster/s back and forth until the shift is up, then back to the Depot.

❖Go to your Shifts tab. You will also notice that there are only 6 shifts now, not a shift for every cluster.

❖Expand one of your Shifts by clicking on the + symbol. I expanded Shift 1 in this example.
❖You will see that 4 clusters fit within this shift.

❖You can export your Routes and Call Points as a layer in SpatialXL. I exported both in this example.

❖I colour themed my Routes by clusters.

❖You can view your Route layer data by viewing your Layer Data Grid.

❖You can copy, save, and pivot your Results to Excel.
❖Alternatively, you can Save Calculation and Load Calculation in your Results tab at a later point for further analysis.

❖Even if you don’t save you calculation, a TS Log will automatically be populated in the location above. You can load any of these into your Results tab for further analysis.
Support
|
||||||
|
T: +27871354351
|
|||||
