Quantitive Vehicle Routing
Quantitive Vehicle Routing

First step define your service points. You don’t need to specially format your data, just make sure it includes latitude and longitude columns. Just tell RouteXL which column means what and you are set to go.
Next define your fleet. This is also user formatted data, just tell RouteXL where to get the capacities, shift times, start and end points.
Now you need to build your matrix, which pre calculates all times and distances between the points to be used later in optimization. RouteXL can calculate millions of these pairs in minutes.
If you add new points to your point set, RouteXL only calculates the distances and times for the new points to save you time.
All this data is saved in a QVRW file, a project file for your routing exercise.
Now you are ready to segment your points and allocate trucks.
All you do is choose the “Dynamic optimize” option. RouteXL automatically plots your points and lets you select points.
Immediately after points are added or removed from the selection, RouteXL calculates the trucks needed and their routes. You can even have RouteXL display the routes, or just straight lines for clarity if needed.
If your selection has no solution, you can click the previous button to go back to the last working selection and try another.
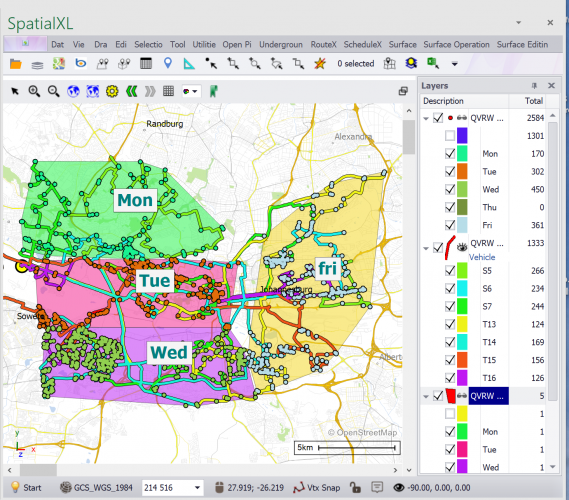
When you are ready you can add these points to a cluster, say for example “Monday shift”
You can do what ifs, by selecting points and then adjusting truck capacities and shift times and clicking “Refresh routes” to calculate the best truck allocation and routes.
Once all clusters have been created you can recalculate all clusters and generate an output report in graphics and spreadsheet showing all the truck allocations, travel times shift times etc.
You can save your routes to any spatial format: shape files etc.
You can perform any spatial analysis on the results using themes and heat maps etcetera.